Interactive technical figure, 2026
Kiosk Anatomy
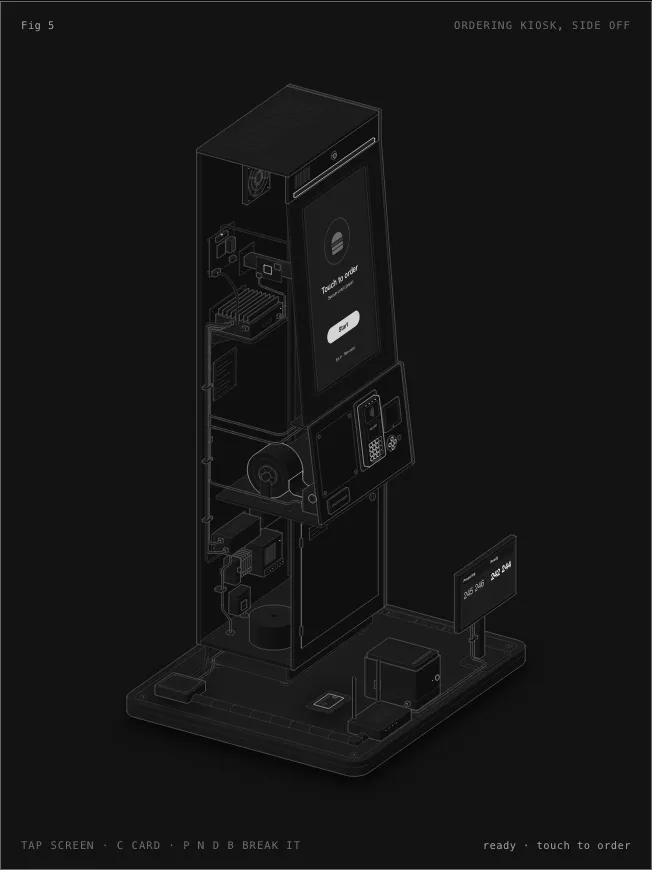
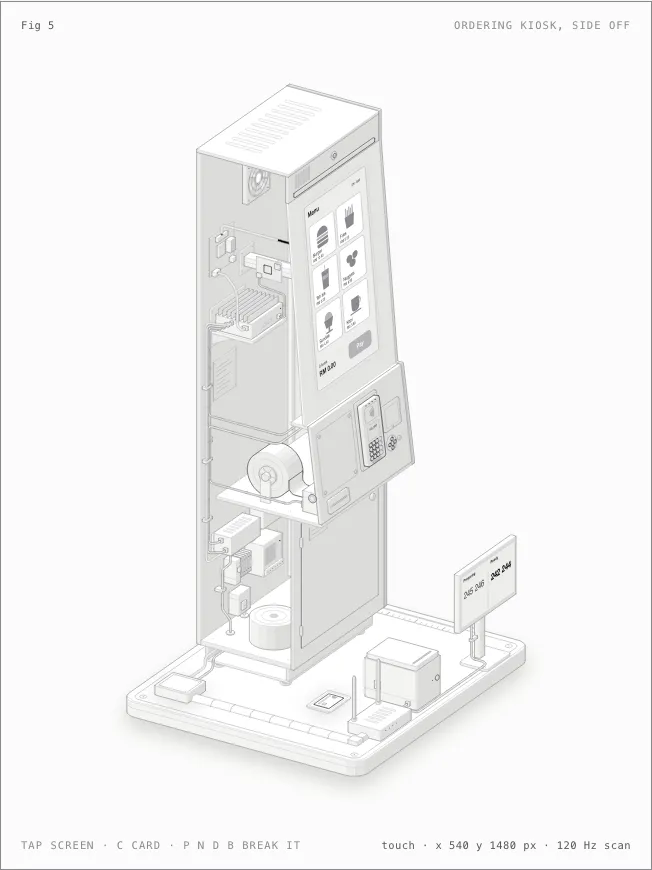
An isometric, working cutaway of a self-service ordering kiosk, from the first touch to the kitchen and the pickup board.
Overview
A figure that explains a real system by letting you operate it. Tap the screen to order and the card to pay, and watch pulses travel the cables to the printer, the bank and the kitchen. Then break it: run the paper low, unplug the network, decline a card, or place an order big enough to need a PIN.
Engineering approach
- A single model file holds every number the figure shows: prices, timings, printer speed and paper roll size.
- A build script writes the drawing, and an audit mode checks clearances, depth order and cable ends.
- Failure modes get the same care as the normal path, because that is where a system explains itself.
The order path
- Touch glass
- Kiosk PC
- Card terminal
- Bank
- Receipt printer
- Kitchen
- Pickup board
Stack
Plain Node ES modules, Generated SVG, Vanilla JavaScript, MIT isometric drawing kit
Technical challenges
Numbers that stay true
- Problem
- An explainer loses trust when its figures disagree with each other.
- Solution
- Every value on the page comes from one model file, so the readout, the screen and the receipt length cannot drift apart.
Depth order in an isometric drawing
- Problem
- Many small parts have to overlap correctly, and a wrong order is hard to spot by eye.
- Solution
- The build has an audit flag that checks geometry directly: clearances, depth order and where each cable ends.
Open to every input
- Problem
- A figure built on tapping shuts out keyboard and screen-reader users.
- Solution
- Every action has a key, status changes are announced through a live region, and the animation respects reduced-motion settings.
Gallery
Outcome and status
Live on GitHub Pages in light and dark versions, with no runtime dependencies.
Known limits
- The kiosk is a model of a typical unit, not a specific product.